Our Simple Data Analytics Process
At Blink, we believe in making data work for you, no matter your background. Our approach to data analytics is straightforward and effective, ensuring that everyone can benefit from the power of data.
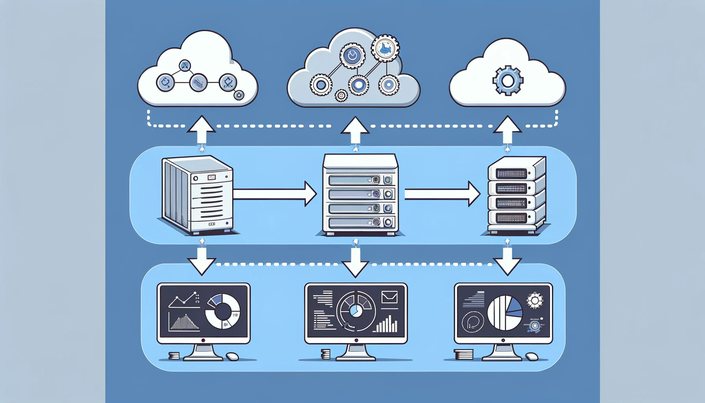
1. Data Extraction:
First, we gather data from various sources relevant to your business or project. This could include sales figures, customer feedback, website traffic, or any other information that helps paint a picture of your operations. Don’t worry about the technical jargon—we handle the behind-the-scenes work so you can focus on what matters most to you.
2. Transformation and Loading:
Once we have the data, we clean it up and organize it in a way that makes sense. This step, known as transformation and loading, ensures that the data is accurate, consistent, and ready for analysis. Think of it like tidying up a messy room—we’re just making sure everything is in its right place for you to make sense of it all.
3. Visualization:
Here’s where the magic happens. We take all that cleaned-up data and turn it into easy-to-understand visuals, such as charts, graphs, and dashboards. These visualizations provide insights into your business’s performance, trends, and opportunities at a glance. You don’t need to be a data expert to understand what’s going on—we present the information in a way that anyone can grasp.